Du Bois visualizations
Lecture 17
University of Arizona
INFO 526 - Fall 2024
W.E.B. Du Bois
Important
The visualizations presented in this lecture are original data visualizations by W.E.B. Du Bois and the captions reflect the language of the time in history.
W.E.B. Du Bois
W.E.B. (William Edward Burghardt) Du Bois (February 23, 1868 – August 27, 1963) was a professor of history, sociology, and economics at Atlanta University and one of the founders of the NAACP in 1909.

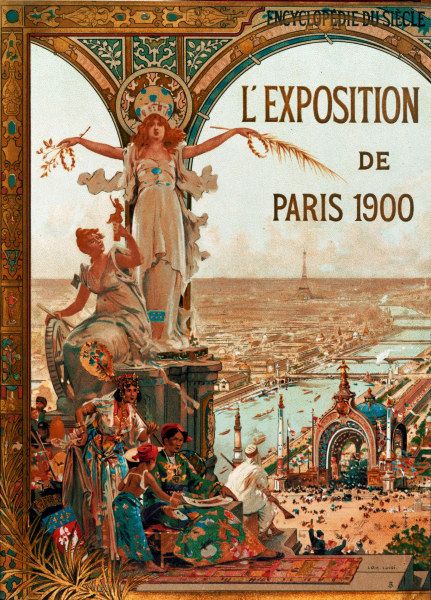
1900 Paris Exposition
1900 Paris Exposition
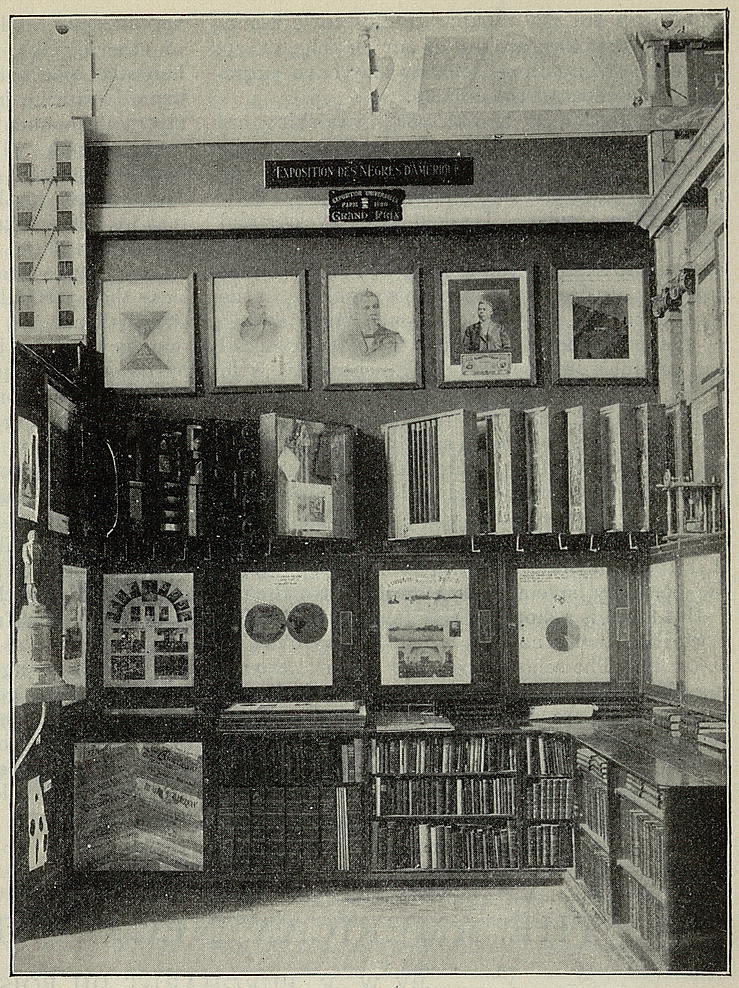
Du Bois’s visualizations were part of the Exposition des Nègres d’Amérique (The Exhibit of American Negroes), an exhibit organized by newspaper editor Thomas Junius Calloway.
The goal of the exhibit was to tell the story of African Americans after Emancipation using a variety of items including texts, portraits, and data visualizations.
The exhibit highlighted the progress made by African Americans, and Du Bois, in particular, used data and visualizations to counter the “narrative of Black inferiority” and to humanize the African American experience.
Visualizations and photographs are available in the Library of Congress digital collection.
Data
Data collected by Du Bois’s sociology lab, government reports, and data from the United States Census by Du Bois and his students.
Used to create two sets of visualizations: one focusing specifically on the experience of African Americans in Georgia and one focusing on more national-level statistics and trends
Style
Hand drawn using ink, watercolor, and graphite.
They stood out from other visualizations of the time with their bright colors and modern style, an intentional design choice by Du Bois to make more effectively convey the message to the Parisian audience.
A few examples + discussion
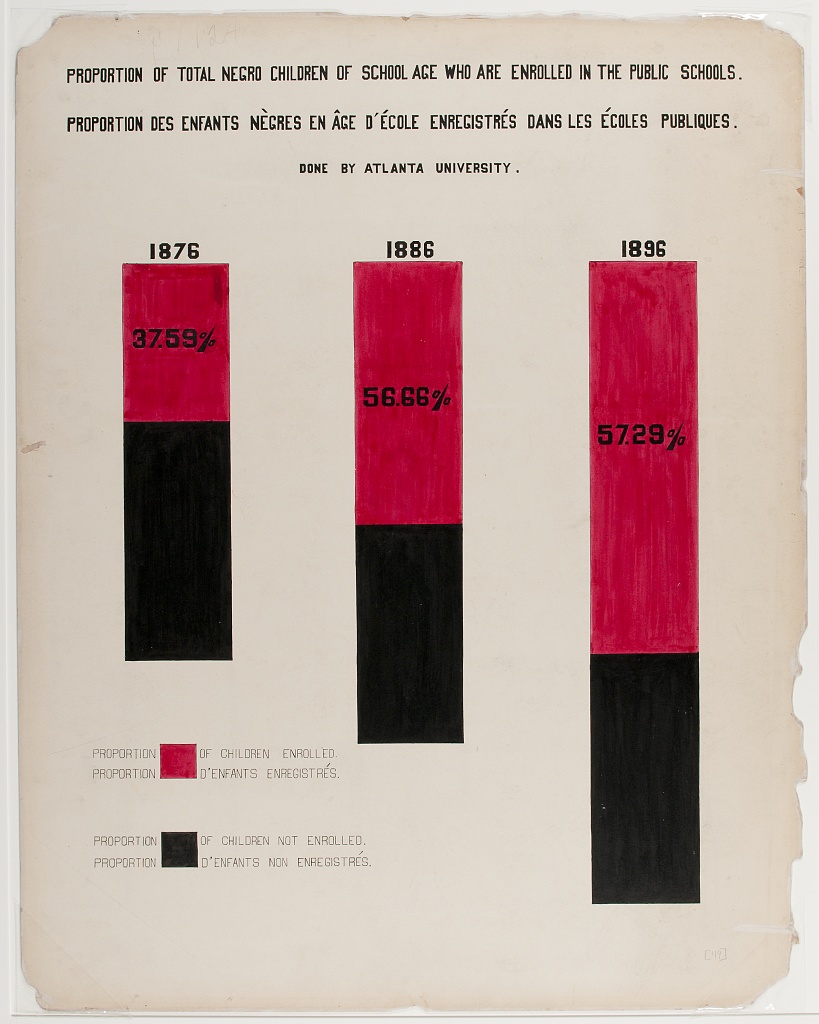
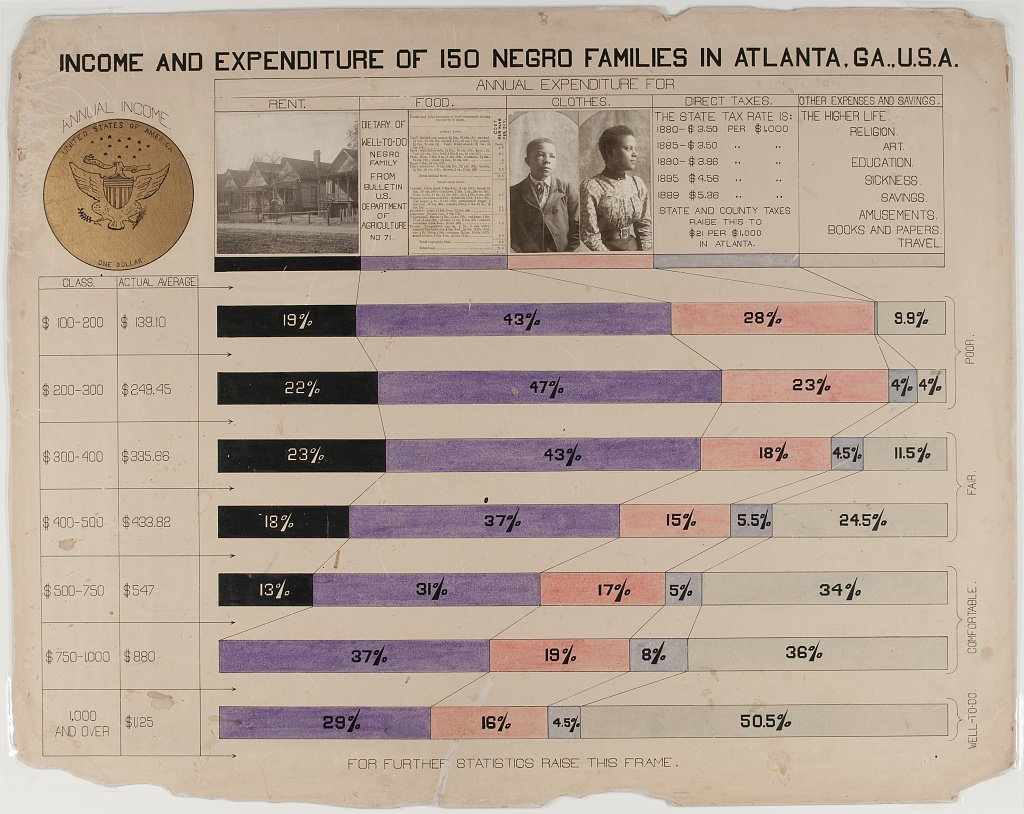
For each of the following visualizations: Review the plot and provide an interpretation for it. Then, identify what is striking as well as features that are in line with common data visualization “best practices” vs. features that don’t conform to them. Discuss whether these help the point being made or not.
Proportion of Freemen and Slaves
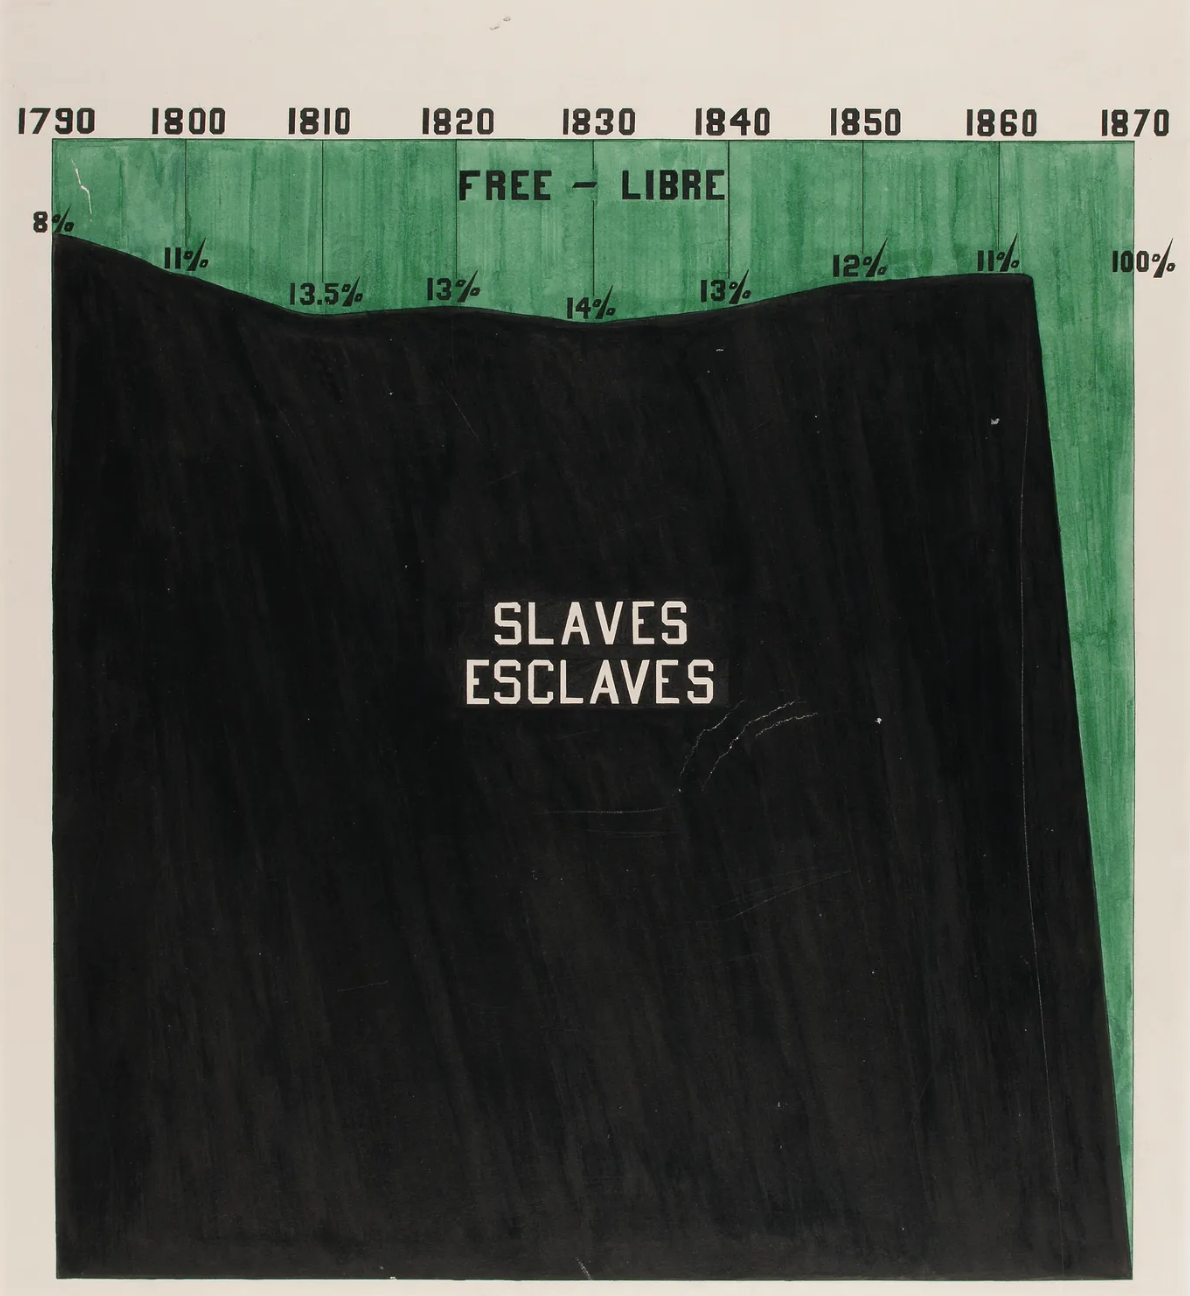
“Proportion of Freemen and Slaves among American Negroes”, 1900, via Library of Congress Prints and Photographs Division
Illiteracy
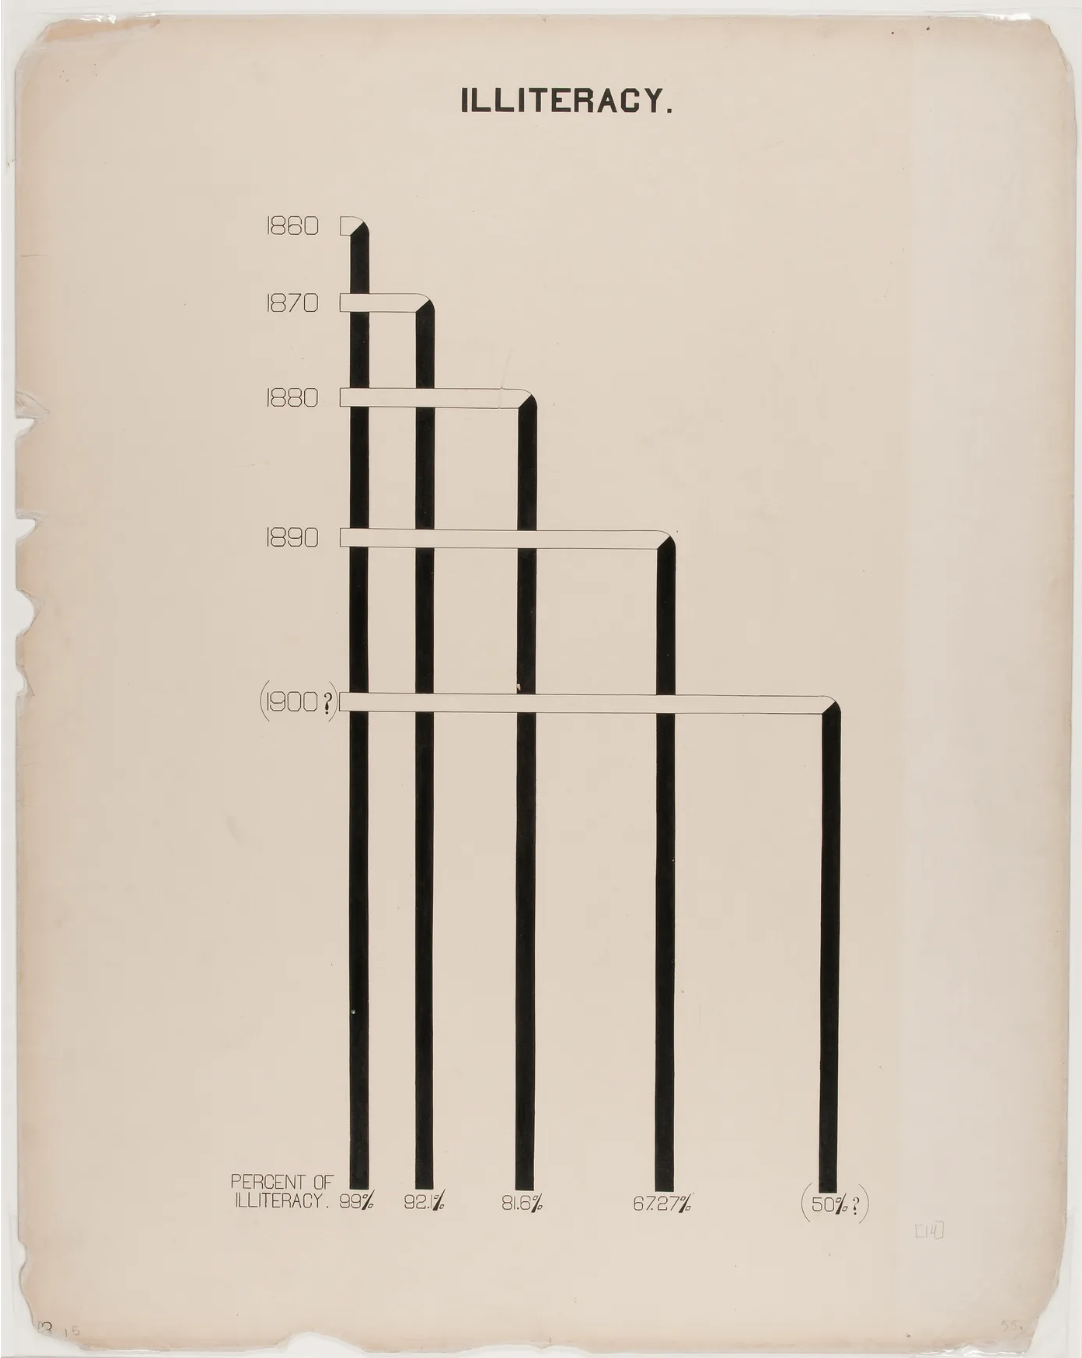
“Illiteracy” 1900, via Library of Congress Prints and Photographs Division
City and rural population
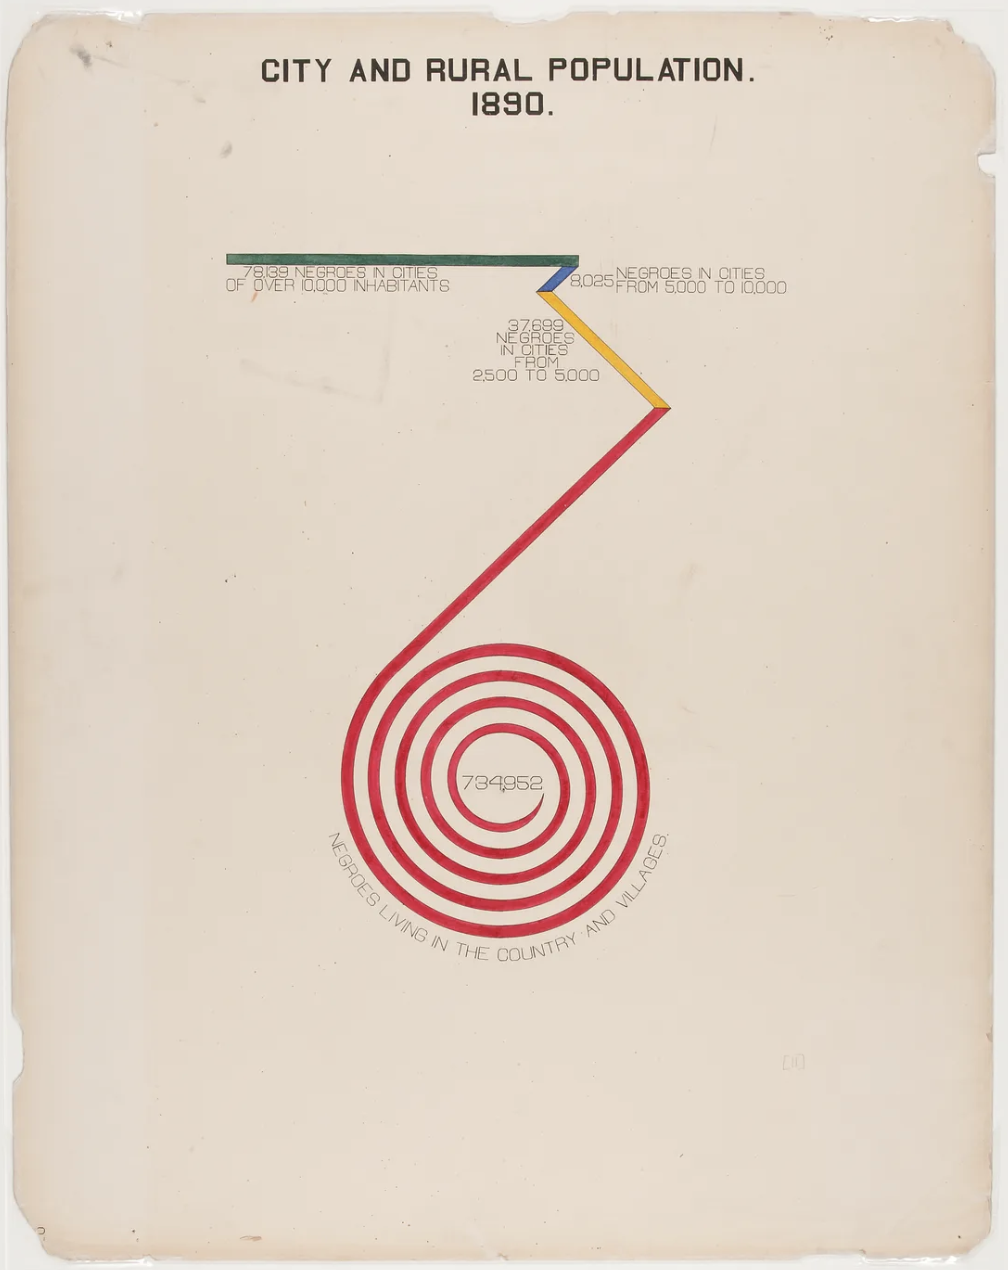
“City and Rural Population. 1890” 1900, via Library of Congress Prints and Photographs Division
Inspiration for today’s lecture
In February 2021, Allen Hillery, Athony Starks, and Sekou Tyler, started the #DuboisChallenge, and annual online challenge where participants use modern data visualization tools such as R, Python, Tableau, etc. to recreate the data visualizations by W.E.B. Du Bois.
The seven-week challenge included 10 out of the 63 visualizations in the original exhibit. Each week, participants were tasked with recreating one of the visualizations and there were three “bonus” visualization challenges. People used social media to share their recreations side-by-side with the originals using the tag #DuBoisChallenge, and many shared the code they used for the recreation.
The challenge took place again in February 2022 and it was featured in 2021 and 2022 as part of the weekly online data visualization event TidyTuesday (https://github.com/rfordatascience/tidytuesday).
Recreation activities
The most prevalent type of visualizations created by W. E. B. Du Bois are bar charts, which inspired your hw-03 recreation challenge.
Further reading
Battle-Baptiste, W., & Rusert, B. (Eds.). (2018). W. E. B. Du Bois’s Data Portraits: Visualizing Black America. Chronicle Books.
Recreations of Du Bois’s Data Portraits GitHub repository: github.com/ajstarks/dubois-data-portraits
Starks, A. (2019, August 21). Recreating W.E.B Du Bois’s Data Portraits. Medium. medium.com/nightingale/recreating-w-e-b-du-boiss-data-portraits-87dd36096f34
Starks, A. (2022, February 1). The #DuBois Challenge. Nightingale. nightingaledvs.com/the-dubois-challenge


